
How are Hudson and its 5,192 residents planning for the future? Are we making wise decisions in regards to our physical and social development? Are those choices in harmony with trends in the Montreal Metropolitan Community (CMM) and our region of Vaudreuil-Soulanges?
Check out the latest CMM profile of Hudson (CMM Hudson portrait 71100).
In just 13 pages, this statistical selfie condemns the Town of Hudson to a slow decline of abandoned homes and impoverished seniors, the cumulative result of our ongoing failure to plan for the approaching post-baby boom demographic implosion.
Some assumptions are nonsensical, like the hypothetical disappearance of 235 of Hudson’s 2240 households between 2017 and 2031. In Hudson, houses are demolished when they’re flooded out or the land is more valuable than the structure occupying it. Addresses don’t stop existing. Garbage in, garbage out.
There’s plenty of cause for concern. The CMM stats point to an approaching affordable-housing crisis for Hudson’s least affluent residents. The 2015 median (half below, half above) income for single-person households was $31,000 compared to a CMM median of $33,000. Ten per cent of Hudson’s residents live below the poverty line. Some 70 households living in rental properties are struggling. Some 265 households spend 30% or more of their gross income on housing. Of those, 140 spend more than half; 35 households are eligible for subsidized rents.
Hudson is doing very little to accommodate the shift to affordable housing. Of the 94 social/affordable housing units listed in the CMM profile, zero are through the provincial AccesLogis program, zero are public low-cost housing units. (I assume the 94 represent Manoir Cavagnal units built under a federal CMHC program which continues to burden the administrators with ludicrous lending terms.)
Tied to that is a stagnation in housing starts. According to the CMM, Hudson issued permits for 19 housing starts in 2018, including three townhouses and zero apartments. We saw the same number in 2009 and 2017. Hudson’s best-ever year was 2015, with 44 starts. The worst was the 11 starts in 2016.
Other data gives cause for hope. Close to 16 per cent of Hudson’s population is listed as recent immigrants. That compares to 25% in the CMM as a whole, but it says to me the Lester B. Pearson School Board and the CAQ government did us a big favour by locating one of their new four-year-old kindergarten programs at Mount Pleasant Elementary School. I see Habitation Robert’s 134-door Willowbrook project as a natural feeder as more and more of Quebec’s mixed anglo/franco marriages confer eligibility to English public schooling.
Another cause for hope is Hudson’s labour and employment profile. The employment rate for active members of the labour force aged 15 and over is almost 57%. (Across the CMM’s 82 municipalities, the employment rate stands at 61%.) According to 2018 data, Hudson is home to 182 businesses. Retail employs the largest number of people by sector — 235. Teaching accounts for 210 jobs, followed by professional, scientific and technical services (195 jobs). Health and social services are tied with arts and culture, with 175 jobs apiece.
Well over half of Hudson’s 182 businesses (104 to be exact) employ between one and four people. Another 37 provide work for five to nine; 24 employ 10-19 and 13 others employ 20-49. Two businesses employ between 50 and 99 people, while two others provide jobs for between 100 and 199 employees.
In terms of mobility, the CMM portrait has not evolved. More than 78% of Hudson residents depend on the automobile to get around. Just over 8.2% use public transit, while 8.9% commute on foot. Among non-residents coming to Hudson, 68% travel by car, 22% by other motorized means (motorcycle, scooter, boat) and 9% hoof it. Employment-related trips account for 16% of displacements from Hudson and 12.8% of the trips into town. Education represents 10.6% of trips made by Hudsonites and 15% of trips by non-residents. A third of all trips made by Hudsonites are within the town, while 55% are to CMM destinations (45% to Montreal, 9.4% to the South shore, 10% outside the CMM).
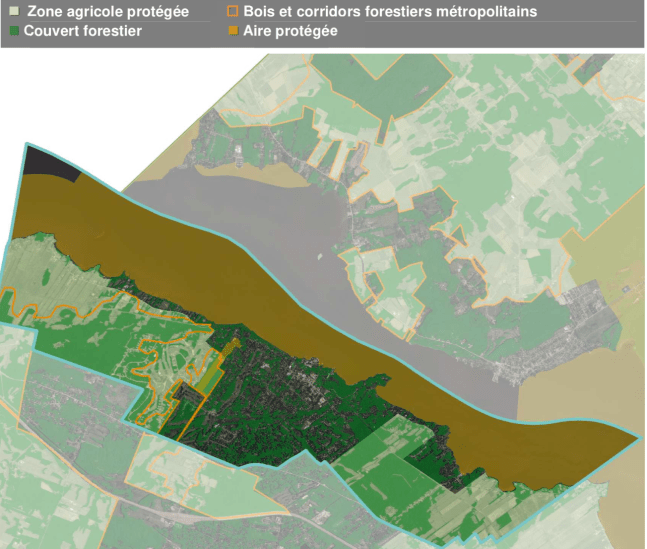
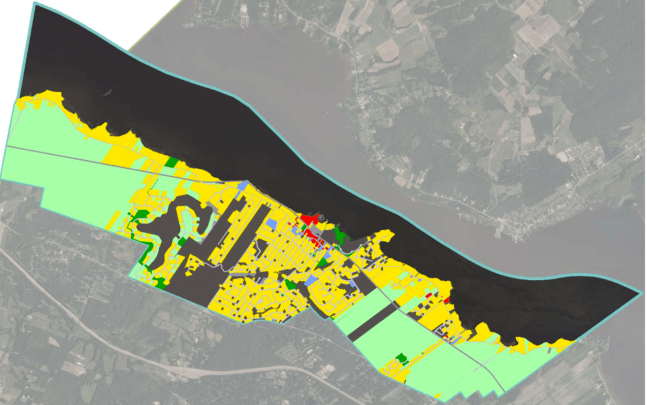
The CMM saves the best for last in its environmental assessment. Hudson’s forest canopy — a measure of mature tree health throughout the municipality — accounted for 1,282 hectares in 2017, 60% of the town’s total land area. Woodlots and green corridors represent 425 hectares, 20% of the town’s total forest cover. Protected agricultural land accounts for 1,289 hectares; wetlands represent 184.5 hectares. Including agricultural lands and conservation areas, Hudson’s protected areas represent 1,452 hectares — almost 60% of Hudson’s total footprint.
Footnote: Waste management data shows considerable room for improvement. While Hudson had a 65% blue-box recycling rate in 2016, we’re falling down on organics, with a 15.8% recycling rate. That was before Hudson initiated the brown bin collections, leaving one to wonder why they bothered to include data they knew was outdated.
What does the PMAD say about densification and transport-oriented development?http://cmm.qc.ca/fileadmin/user_upload/pmad2012/documentation/20120813_PMAD_eng.pdf
