
In a brilliantly choreographed show of strategic contrition, the Legault government has taken barely a month to walk back its threat to shut down waterfront development in flood zones.
Well, sort of walked it back. All municipalities now have the competency to allow owners of at-risk properties to ‘immunize’ their dwellings with waterproof foundations. Some, like Ste. Marthe-sur-le-lac, will continue to protect flood-prone developments with dikes, levees and seawalls. Red-line surveillance will be up to regional government — MRCs and the 82-municipality Montreal Metropolitan Community.
Is this CAQ contrition pivot a variant on the same old political game? I don’t think so. Even if the CAQ walks it back by 50%, the red line is changing everything. I attended the July 4 public consult at the Chateau Vaudreuil, where stories of cancelled home insurance and blocked real estate deals resonated with a skeptical crowd. The sitting ducks at the front of the room were from the ministries of the environment, municipal affairs and public security. We wondered whether they were paid extra to absorb the verbal beating.
Interesting facts emerged in the course of the three-hour marathon, well emceed by Duncan Campbell. The meeting began with an admission by the environment ministry’s Nathalie Provost that there were many inaccuracies in the original June 17 red zone mapping; they would be corrected on the basis of submissions by municipalities and individuals. A revised version of the red line was promised for July 17 and a deadline for revisions set for Aug. 17. MRCs will be allowed to lift the ZIS/SPZ in specific municipalities once the ministry is satisfied. A provincewide “elaboration of land use planning action pertaining to flooding” policy will be in place by Dec. 19.
Quebec’s unforced admission and revision commitment didn’t stop people from emoting about the trauma of having their high, dry home arbitrarily placed in the red zone. Several Hudson residents expressed their concern at the vagueness of the process. Others gave vent to variations on a popular flood conspiracy theory — that Hydro Quebec deliberately held back water in its Ottawa River reservoirs in order to be able to sell more subsidized power to the Americans. Many who spoke at last Thursday’s meeting voiced fear this government will cover up the conspiracy while downloading financial and social costs of Hydro’s complicity onto municipalities and their citizens.
Many from the Lake St. Francis side of Vaudreuil-Soulanges were there to point out obvious flaws in the red-line mapping and to demand their correction. (With major hydro dams at each end, Lake St. Francis water levels don’t tend to fluctuate.) St. Anicet mayor Gino Moretti led a delegation of townspeople demanding that their town’s waterfront be removed from the red line. “We have memories going back nine generations […] nobody can recall it flooding.” Moretti told the room. Earlier, Moretti told me his town risked losing up to 20% of its valuation. “Why is Lac Saint-François in the flood zone? It never floods.”.
Those in the hall supplied other disturbing facts, like the dumping of thousands of tonnes of rock into the shallow, rocky channel between Vaudreuil-Dorion and Pincourt. It was the cheapest place to dump spoil from the construction of the new Champlain Bridge but it had the effect of raising water levels upstream.
A St. Stanislas resident wondered whether the scientific basis of the red line was tainted by the use of addresses of people who may have received flood compensation. For a crowd fixated on a vision of incompetent bureaucrats running amuk with red markers, it was more grist for the mill.
Some petitioners attempted surfing on the crowd’s emotional waves, like the Hudson resident wondering whether the red line should be extended to eco-sensitive wetlands and forests of interest. Why, he wondered, would Quebec not compensate municipalities for keeping their wetlands and greenspaces undeveloped?
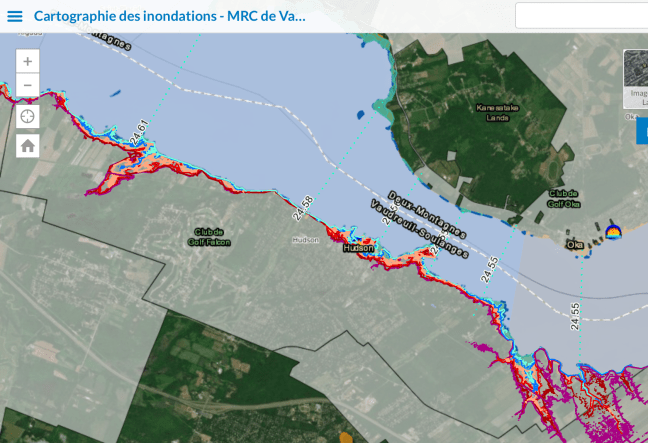
How did the red line get decided? It’s a story told in maps.
At the top of this page is a map generated from overlays of 2017-2019 satellite data and a comparison of flow rates. It was supplied to Vaudreuil-Soulanges MRC municipalities on Friday, April 26 as civil protection authorities were grappling with the suddenness of the rise in water levels. Sandbagging and other protection measures began earlier in 2017, partly because the Legault CAQ was insisting to us that it was done subsidizing bailouts for victims of repeat flooding. Hudson was among the many Vaudreuil-Soulanges municipalities reluctant to spend money without knowing whether Quebec would reimburse legitimate flood-related expenses. Elected officials were discouraged from calling in the military to sandbag private property; in retrospect, we should have used their equipment and manpower to install jersey barriers — sectional concrete dividers — to break the waves and hold back the surge of debris in several sectors of town.
In hindsight, there wasn’t much that Hudson and other shoreline municipalities could have done to hold back the Ottawa. Above-average snowfalls, a late thaw and heavy spring rains filled rivers throughout eastern Canada. Dozens overflowed their banks, flooding low-lying areas along the Ottawa, Chaudière, Saint-Maurice, Saint John and St. François. Civil protection authorities in Ontario, Quebec and the Maritimes were overwhelmed. Municipalities all over eastern Canada were demanding federal and provincial assistance to armour key installations and evacuate/shelter flood refugees.
The Ottawa is Quebec’s worst headache because it threatens Greater Montreal and thousands living in flood-prone areas at the conjunction of the St. Lawrence. Flow rates in the St. Lawrence are monitored and controlled by the International Joint Commission, which balances competing demands from municipalities, industry and commercial shipping interests with a mix of dams, dikes, locks and control structures.
The Ottawa River Regulating Committee’s charter is based on the IJC, but there’s more than one cook in this kitchen. Hydro-Québec oversees operation of five dams and reservoirs; Ontario Power oversees three. Government Services Canada is responsible for two more, while Environnement Québec runs the three centrals on the Lièvre River.
Before heading to the Chateau Vaudreuil, I ran into Wharf Road resident Richard Grinnell at the Hudson IGA. Like thousands of waterfront residents touched by this spring’s repeat of the 2017 flooding on the Ottawa River, Grinnell believes deliberate decisions taken by Hydro Quebec and other dam operators were factors in two catastrophic floods in three years.
He cites Hydro’s own data to show it didn’t release enough water from its reservoirs in in the springs of 2017 and 2019 to create adequate capacity for record runoff from heavy rain atop multiple layers of ice built up over a winter of freeze/thaw cycles. Two bad winters in three years should be all the proof anyone needs to demand an inquiry into the practices of public utilities and their role in the 2017 and 2019 flooding.
Third parties and NGOs such as the Ottawa Riverkeepers don’t agree, noting the absence of large reservoirs that would allow a stakeholder to assume control. Water levels and streamflow data on the Ottawa River and its tributaries are overseen by the Ottawa River Regulation Planning Board (ORRPB), created in 1983 to: “endeavour to ensure that the integrated management of the principal reservoirs of the Ottawa River basin provides protection against flooding along the Ottawa River and its tributaries, and particularly in the Montreal region and thereby augments the principle of ‘no less protection’ to downstream interests contained in the International Joint Commission’s orders of approval for regulation of Lake Ontario.”
One’s actions must not impact on anyone living downstream.
The ORBB has compiled Carillon dam streamflow data since 1964, the year the dam was completed. One can easily compare annual peaks, lows and means for every month of every year the dam has operated. Average peak flows over the first four months of high-water years range between 2,960 cubic metres/second in 1981 and 3,261 metres/second in 2017. In 2019, the four-month average was 3,051 cubic metres/second. The only trend I can see is a gradual increase in flow rates since 1964, suggesting that more runoff is feeding the Ottawa River watershed.
Hudson counts some 200 homes touched in some way by the 2017 and 2019 flooding. Some 60 of those were turned into more or less dry islands rendered inaccessible by flooded, eroding debris-covered private roads. Another 34 were flooded to the extent that Hydro Quebec cut their power at the transformer to protect life and limb. Driving around town at the flood’s peak, we saw Main Road cut from the ferry eastward, with close encroachment of the water next to Finnegan’s and at the foot of Montée Manson. We lost Wharf, Halcro and all or part of a dozen other public and private streets. Already, construction and renovation projects are being affected by the red line. Clearly, the red line raises concerns about the resiliency of the Pine Beach project as currently configured.
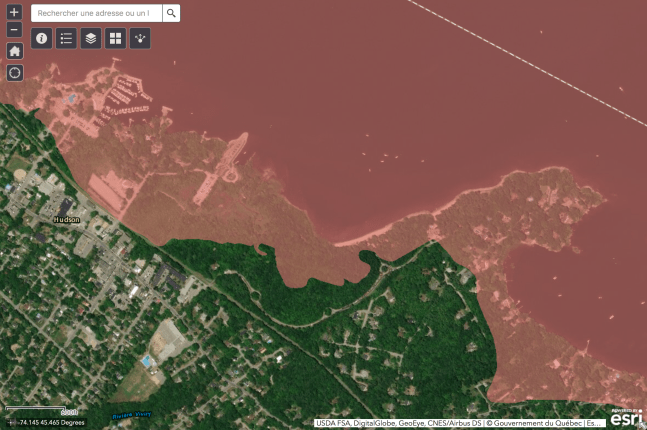
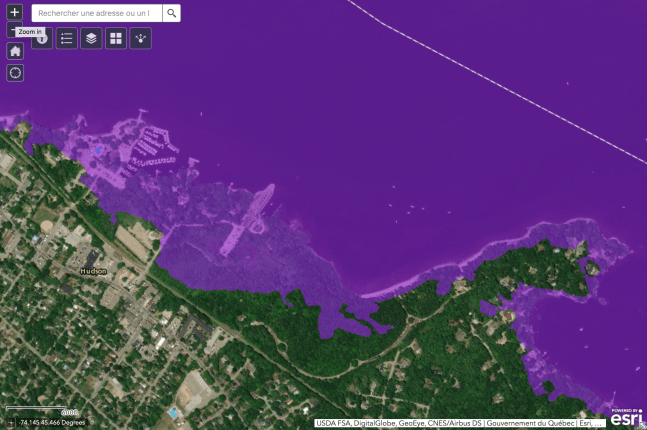
In 2018, this council adopted a new-construction ban between the 20 and 100-year floodlines. As the water rose again this spring, we realized the need to establish a high-water mark that could stand up in court. As the water rose, the town hired a drone to trace the high-water line along the 12 kilometres of shoreline. It also hired a photographer with a GPS-co-ordinated camera to validate the drone’s flight at ground level in certain sectors. The results were shared with the ministry compiling the red zone map. As you can see by comparing the second and third maps, there are minor differences between the June 17 and July 15 versions.
I can grasp the desperation of someone like Pincourt resident Robin Pope. She and her husband sold their lakefront home on the condition the buyer is able to build a garage. After buying their dream lot nearby and planning construction of their new home, the red line decreed by the June 17 order in council placed their old house on the edge of Pincourt’s red zone and killed their buyer’s plans for a garage. Everything is frozen. “Our houses are our economic safety nets, Pope told the sympathetic crowd. “You’ve cut us off at the knees.”
This is the dilemma we face. Should Hudson concentrate expenditures on its municipal structures — lift public roads and sewage pumping stations and ensure the resiliency of our water, sewer and drainage systems? Raising Main Road at Finnegan’s, the ferry and Montee Manson would cost hundreds of thousands; is it a worthwhile investment? Is there a cheaper, more resilient way of repairing the installations at Jack Layton Park and Sandy Beach? Should the public purse be opened to assist in floodproofing private neighbourhoods and cul-de-sacs? The money has to come from somewhere and at this point in the 2019 budget, has to come out of something else. On the other hand, waterfront real estate represents a big chunk of Hudson’s roughly $12 million in tax revenues; does it make economic sense to participate in shared-cost projects (raising low-lying streets, adding wave protection) to safeguard that investment?
It would be great if Hydro agreed to foot part of the the bill but I can’t see that happening in Quebec in 2019. The trouble with conspiracy theories: they’re hard to prove. Maybe Hydro-Quebec is a guilty party in a civil action. To what degree? 25%? 50%? Solely and totally guilty? Say a judge approves a class action lawsuit. How long will it take to get to court, to go to appeal or settled out of court? Longer than it takes people to get on with their lives.
That is what will decide the red line. Hard, verifiable data, presented by a good lawyer. Those with money and perseverence might see a payoff. I favour negotiation and common sense.
Good advice update:
The original ZIS/SPZ red line included part of District 5 resident Diane Piacente’s Hudson lakefront property. Piacente, one of the Hudson residents at the packed Chateau Vaudreuil public forum, followed advice given out. “I sent an email to the email address provided and sent photos of the waterfront, my fence (which sits on the 100). [They show] how far the house is, the pool, the shed and kayaks. Also sent scanned copy of certificate of location showing flood lines.”
Piacente thinks the town should have explained the process to its citizens sooner. ” This was a serious issue, especially if you are trying to sell your house, extremely stressful for those concerned. “Sure, you have until August 19 to notify the government if you are in the red zone and shouldn’t be but if you were in their shoes wouldn’t you like to have this settled sooner than later? Glad they are listening and fixing.”
