

Finally, Hudson has a Quebec-approved plan to address the municipality’s notorious infrastructure deficit. Council unanimously adopted the final version of the intervention plan at the Nov. 5 meeting a month after receiving MAMOT approval.
It’s taken almost 11 years to get to this point, but for most of that time, most Hudson residents, myself included, never knew the town needed an intervention plan in order to qualify for municipal infrastructure funding. It works like this:
Back in 2005, Ottawa created the Federal Gas Tax Fund, a permanent source of funding for municipalities to build and revitalize public infrastructure across Canada — roads, bridges, water, energy, public transit and solid waste management systems. Conditions applied. Quebec being Quebec, it wanted a say in how the money got spent. So it created TECQ, funded by the feds but managed by Quebec’s municipal affairs ministry. MAMOT attached its own strings. TECQ grant applications had to cover four years and address Quebec’s list of priorities, beginning with drinking water and sewers. Municipalities could fund road repairs with their TECQ money only after potable water, stormwater and wastewater needs were met. Before it could apply for TECQ funding, a municipality had to submit to MAMOT an up-to-date intervention plan — an inventory of the town’s capital assets and their state of repair.
Engineering consultants Maxxum were hired in the summer of 2017 to work with Town managers to draft a preliminary intervention plan. It was submitted to MAMOT Nov. 9/17. On Feb. 23/18, MAMOT engineering staff replied with comments which required a response. MAMOT received the Town’s response Aug. 14 and replied Oct. 4 — after the Town’s 2018 paving program was completed.
My summary of the final Maxxum report:
The Town of Hudson contains 82 km of water mains, 12 km of sewers, 2.6 km of storm sewers and 76 km of roads. The town is fortunate insofar as its water mains and most of its sewers and storm sewers are relatively new and have plenty of useful life left.
That doesn’t mean they don’t need continuing investment to keep them that way. Our aqueduct network requires $1.875M ANNUALLY. Sewers and storm sewers also require annual investments of $115,400 and $67,600 respectively.
The biggest problem with the aqueducts is that while we began collecting data on water main breaks in 1983, the historic excluded service entrances, corporate stops and “poteaux d’incendie.” Experience has shown these are the source of most of Hudson’s water leaks.
Roads are another story. Maxxum recommends that the town invest $9.1M in integrated upgrades (water + sewers + storm sewers + roads) to bring the road network up to a minimum sustainablity standard. Just keeping the roads as they are will require a minimal ANNUAL investment of $2M +
Once one understands how the plan is laid out, interesting factoids jump out.
Example: a 227-metre segment of Main Road between civic #s 302 and 322 will require water main remediation and repaving totalling $377,610. It was the most expensive segment I could find.
I counted more than 100 segments of road with RMC (réféction majeure de chaussée) designations. Almost all had 4 and 5 ratings — bad or very bad.
Of the storm sewers, the stretch on Cameron between Main and St-Jean has expended 82% of its expected lifespan. Of the 2.6 km of storm sewers, 1 km will turn 50 within the next 10 years, meaning that when that stretch of Cameron is due to be repaired, the storm sewer should be part of the total.
That’s the takeaway from the Maxxum plan. If we’re fixing the town, let’s do it right the first time and according to the intervention plan.
Ask most people how they want their tax dollars spent and they’ll say “better roads and sidewalks.” A longtime Hudson resident moved to St. Lazare because his wife was sick of her car getting beaten up on Windcrest. Cyclists tell me they won’t ride on Main Road because they’re risking life and limb. They can’t understand why we don’t just repave Hudson’s streets, starting with Main Road.
So there was serious confusion when this summer’s $2 million paving blitz included side streets in far better condition than a number of major arteries. Back in September, a District 5 resident requested a schedule of roads to be resurfaced in 2018, those to be done in 2019 and how priorities were decided, “for instance why a low traffic road like Lower Whitlock would be a priority over the far higher traffic volume Main Road.”
I wrote him back with the following:
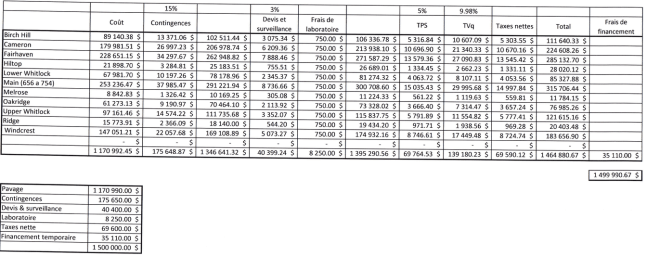
To answer your first two questions, the document above is the schedule and original estimate for 2018.It was to be funded by Bylaw 670.1, adopted by the previous council prior to the 2017 dissolution.The current council was informed that (a) the schedule did not follow the hierarchy of needs set out in the draft intervention plan required by MAMOT to govern infrastructure expenditures, and (b) that the 2018 cost of resurfacing these streets was $470,000 more than the 2016 estimates.As regards the cost overrun, MAMOT allows a loan bylaw to be revised on this basis.So 670.1 was revised from $1.5M to $1.97M.This is reflected in the refinancing resolution we approved in September.Concerning the intervention plan, council will be approving the final version shortly.The 2019 repaving schedule will be priority-based as established by the intervention plan.To answer your last question, it was decided in absence of a final intervention plan to repave according to two criteria:1) Refrain from cosmetic repaving wherever a road needs serious infrastructure work (drainage and culvert replacement, aqueduct/sewerage remediation);2) To repave streets where a coat of asphalt will prevent further degradation.Example: In the late ‘80s the town dug up Main Road between Cote St. Charles and Beach Rd. to install new aqueducts.The piping itself is in remarkably good condition but the mild steel saddles and corporate stops have rusted to pieces wherever they’re in clay.This represents roughly 85 addresses.We saw the result at the exit to the IGA parking lot last winter and more recently, the breaks next to the former Habib’s and Legg’s.These breaks necessitated digging up the pavement (and in some cases, the sidewalk) and installing bronze saddles.Former technical services director Trail Grubert counselled the town to replace them all in one go and force recalcitrant property owners to connect to the sewer network before investing in new sidewalks and repaving. (These represent roughly a quarter of the 700 addresses that CAN connect.)As councillor for District 5, it bothers me to see arteries in need of serious remediation, like Lakeview, Oakland, Elm and Maple, neglected while less-travelled streets got a fresh coat of asphalt.But as a councillor representing the Town of Hudson, I see the necessity of balancing cost and needs.I apologize for rattling on, but as you can see, this isn’t a simple matter of heeding the squeaky wheel.I’ll have news of the 2019 repaving program shortly and welcome your comments.Jim
For those still with me, here’s some deep background I compiled in January 2018 and shared with Council:
Back in 2005, MAMOT produced its first Guide d’elaboration d’un plan intervention. The idea was to oblige municipalities to apply standard measurement tools to the task of determining how federal, provincial and municipal tax dollars should be spent on infrastructure. In 2013, MAMOT revised the Guide to include storm sewers and the roads above underground installations.
In 2011, Quebec adopted its Strategie d’économie d’eau potable. It obliged municipalities to establish water consumption baselines, which meant towns like Hudson had to get serious about collecting consumption data and using the information to design a program to identify and repair leaks in the system. It also required water meters in non-residential buildings as well as in a sampling of residences for comparison and made some infrastructure grant categories conditional on data thus gathered.
In 2015, MAMOT came out with the Rapport sur le coût et les sources de revenus des services d’eau. Besides putting a 2012 dollar figure on the real cost of water — $2.26 per cubic metre, roughly a penny a gallon — it extended the cost and revenue streams for water services to include all water services — potable water sourcing, treatment and distribution as well as wastewater collection and treatment.
The $2.26-per-cubic-metre figure is now the baseline for all future calculations regarding water infrastructure. That number is regularly adjusted in light of research on the life-cycle replacement costs as well as escalating service costs and salary increases.
The Rapport sur le coût et les sources de revenus des services d’eau was never meant to deal with how these services should be financed or taxed. Since then, however, Quebec has come to realize the real cost of drinking water also includes maintaining, replacing and refinancing all infrastructure related to water. Not just potable water, but wastewater, storm water and the roads and sidewalks above. It also includes the cost of preparing for, and dealing with the cost of climate change.
Last December MAMOT published its Portrait des infrastructures en eaux des municipalités du Québec (PIEMQ). Compiled by the Centre d’expertise et de recherché en infrastructures urbaines, the PIEMQ presents a province-wide analysis of the current state of municipal potable water, wastewater and storm water infrastructures as well as the roads above.
Besides compiling a municipality-by-municipality picture of the current state of our aqueducts, sewers, treatment plants and roads, PIEMQ provides indicators to MAMOT of medium-to long-term maintenance and replacement costs.
The report divides municipal water infrastructures in Quebec into two basic categories — linear, as in major population centres, and sectorial (ponctuel) as we have in Hudson and most semi-rural municipalities where only certain sectors can access services.
The 577 larger, more centralized municipalities with linear systems collectively represent 30,000 km of water pipes with a replacement value of $30 billion, 25,000 km of sewers (replacement value $31 billion) and more than 13,000 km of storm drains (replacement value $17.2 billion.) Some 25,000 km of roads above these systems would cost $28.9 billion to replace.
PIEMQ found urban infrastructures to be in relatively good shape compared to their smaller counterparts (such as Hudson). Almost half (48%) of the 4,153 sectorial infrastructure installations are at a high to very high risk of failure while the rest range from low to moderate.
The numbers attached to this small-town infrastructure deficit are mind-boggling: 3,400 km of water lines, 2,600 km of sewers, 400 km of storm sewers, 11,800 km of roads, 1,700 potable water installations and 2,450 wastewater treatment systems require “more or less short-term intervention.”
The report stresses its ratings should be used as a measure of time left in a life cycle rather than as a risk assessment.
The cost of repairing or replacing infrastructure assets in Hudson and 822 other Quebec municipalities rated as having a high to very high risk of failure is roughly $29.5 billion.
What we need to take away from PIEMQ is the awareness that infrastructure investment is a constant budgetary priority that rockets out of control if councils are distracted by the need to please a fickle electorate with nice-to-have expenditures.

Jim, great information. Thanks for the hard slog through numbers and facts.
Does this mean that we’ve missed TECQ funds that have been available since 2005 ?
If so, I’m shocked that it took this long to become aware and to get a plan in place.
If we’ve missed funding, what’s the approximate annual value of that funding, if Hudson were to have applied and used it properly?
We have known about the mild steel saddles for a long time.
We’re long past a reasonable time to hook up to sewers voluntarily. Time to make it mandatory.
LikeLike
Sorry I missed your response.
No, we missed none of the eleigible grants but we would have been in trouble for the next four years. I don’t know whose fault it was but Phil Toone fixed it in time.
LikeLike